+1-234-678-9955


Improve your production quality by optimising production processes using Technical Cleanliness. Gläser CleanTec is your competent contact for this.
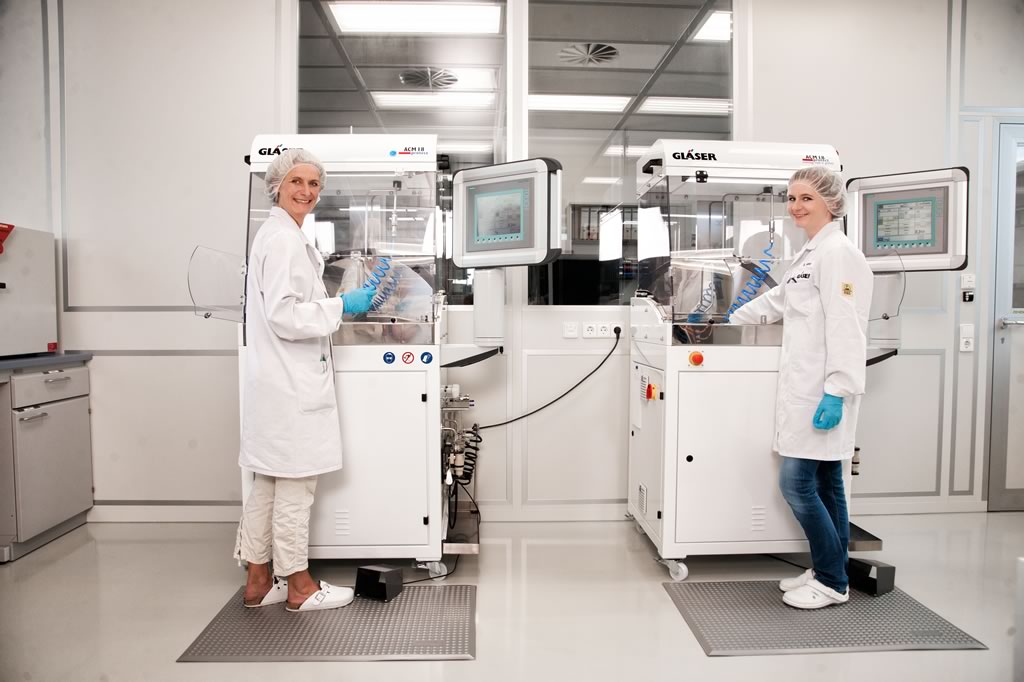
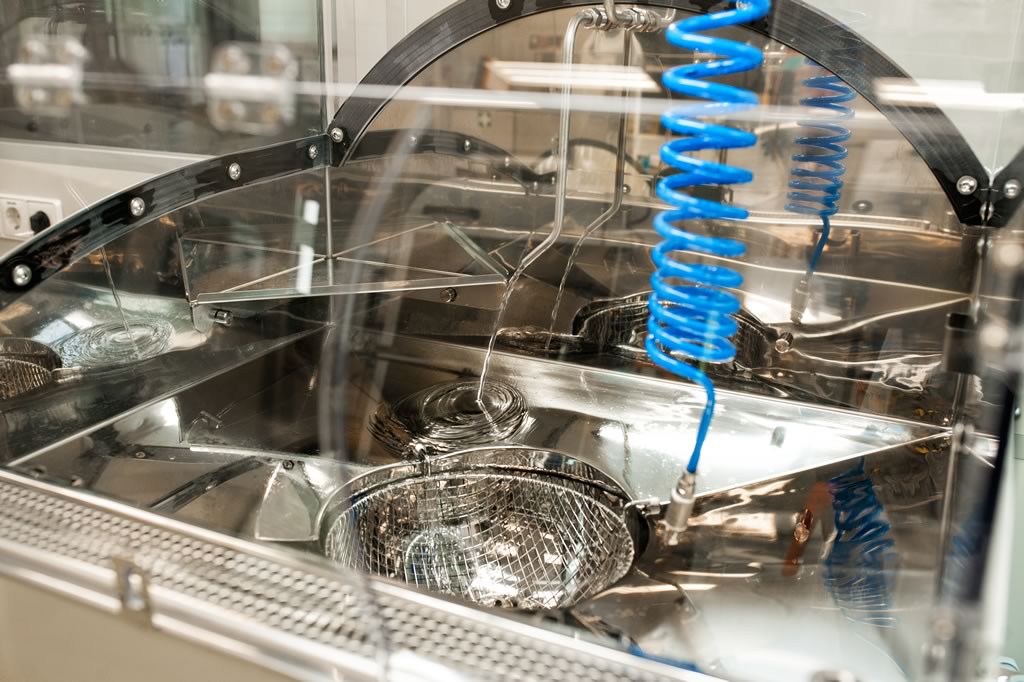
With the very latest laboratory equipment, a ten-strong, highly trained laboratory team will investigate your components in the company's own 200 m² cleanroom in accordance with VDA 19.1 and ISO16232. Whether big or small, we can explore your individual requirements and conduct particle analysis on very small parts weighing just milligrams, up to large parts with a total weight of 500 kg.
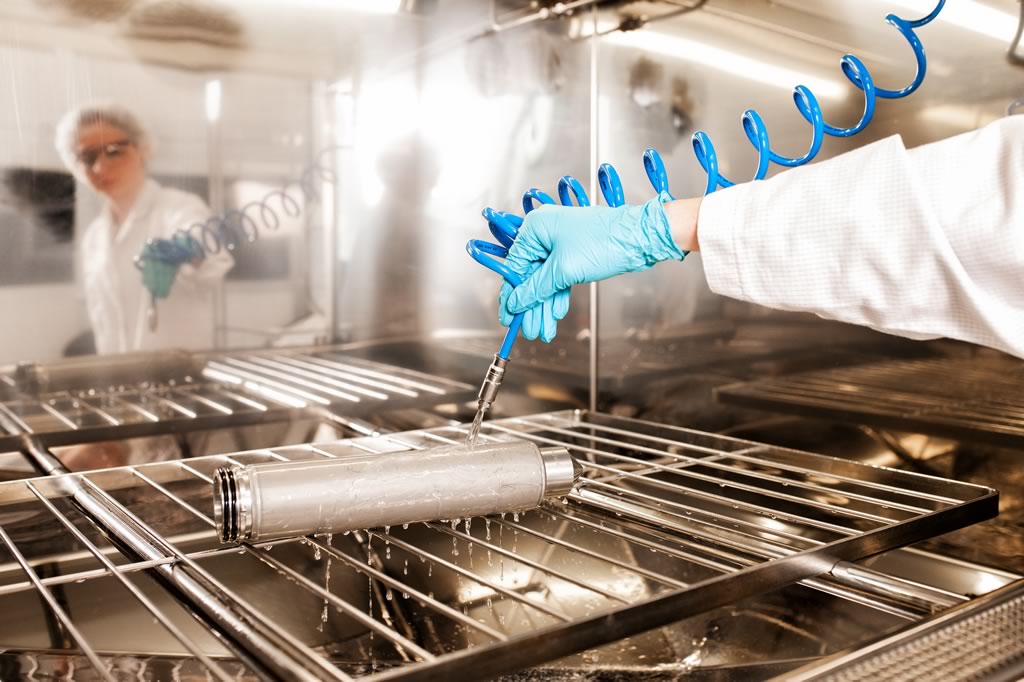
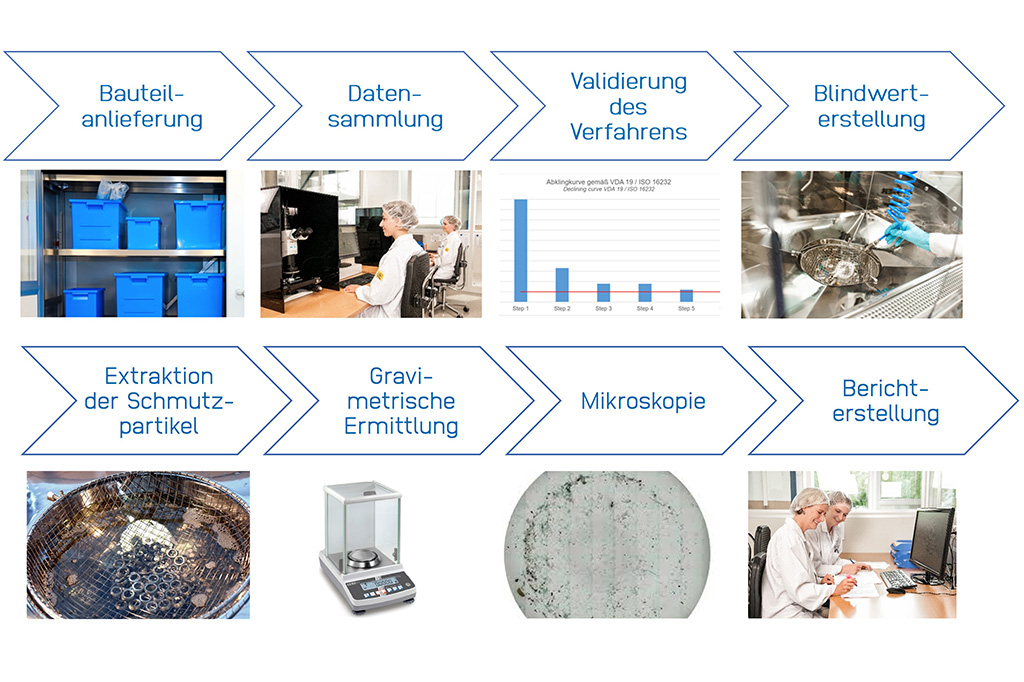
The following procedures are performed on your component on our own extraction systems:
In comparison to light microscopic analysis, an even more detailed analysis of your particles can be performed on the scanning electron microscope (SEM). On the scanning electron microscope (SEM), our experts will determine the precise chemical composition of your dirt particles
Automated membrane filter counting:
Particle count by size classes and chemical classification of the particles
Identification of individual particles
Investigation of unrecognised residues
The world of particles is versatile. It doesn´t end with the classification between „metallic shiny“ and „nonmetallic shiny“. In addition to hard, soft, conductive and non-conductive particles, organic and inorganic residuals on the surface of the component are often the reason for quality decrease in the production. You want to fulfill your customer requirements? We help you keep your processes clean and can advise you on the different analysis possibilities. Our analytics portfolio includes the following extended analyses:
Particle analysis with SEM/EDX*
Metallic and mineral particles will be, beside their size, analysed on their element composition. Because of the knowledge about the composition the hardness and the conductivity of particles can be identified and determine the potential for damage. You can also draw conclusions about the origin of the particles and thus eliminate the source of the contamination.
Examples for hard (abrasive) particles:
Analysis of organic particles/fibers or filmic contamination by FTIR spectroscopy*
Not only particles and fibers but also filmic contamination like coolants and lubricants as well as other coatings and non organic particles like for example synthetic material, cellulose or wood can be responsible for disruptions in the manufacturing process. With FTIR spectroscopy, you receive detailed information about type of organic contamination to optimize your process chain in the next step. Your result: going „oil and fat free“ in the next process step.
Examples:
Determination of surface tension (Test inc method)
Determination of surface tension by using test inc in the range of 32 - 44 mN/m in accordance with DIN 53364 or ISO 8296. The determined surface quality provides information if the surface is suitable for further processes like gluing or printing. The generated results show the current status quo on your component.
Gravimetric NVR determination - Test for non-volatile residuals*
Based on ISO 759 the non-volatiles residues (NVR) on the component surface will be separated by solvent extraction and analyzed gravimetrically after evaporation. This analysis is for the quantitative determination of non-volatile ingredients, which can affect the quality and performance of your product. This test is more and more important in the electronics or medical device manufacturing as well as in the chemical and pharmaceutical industry.
Air analysis for organic contamination by GC/MS*
For this analysis of indoor air on volatile and non-volatile organic bonds, the air specimen will be analysed unter the gas chromotograph with mass spectrometer. The results informs about the pollutant content in the air. The air measurement is made in accordance with ISO16017-1, 16017-2, 16000-6 and analytics according to VDA 287.
Emission measurement of components with GC/MS*
We offer an analysis in tje gas chromotograph with mass spectrometer for the determination of volatile ingredients on your component. Small components (45 mm x 30 mm), midsized components (245 mm x 265 mm) up to large components with the size of 555 mm x 870 mm can be analysed. Furthermore, there is the possibility depending on the operational environment of your component, to carry out the analysis also at higher temperatures up to 300 °C. The measurement is made according VDA 2083 sheet 17 and ISO 12219-3.
Analysis of ionic contamination on components´ surface*
If you need qualitative and quantitative information about the contamination of your moduls to indentify the surface quality, the analysis by means of Ion chromatography (IC) is the right one. After the extraction of contamination using high-purity water (according to SEMI F57 / IPC-TM-650 23.28.2), follows the analysis with high-purity water on cations (according to ISO 14911) or anions (according to ISO 10304-1).
ROSE test (ionic contamination measurement)*
The ROSE test captures quantitatively the ionic contamination on electrical modules, which can occur as a result of soldering and electroplating pricesses. On conpoments like circuit boards, ionic contaminations are often reason for serious malfunctions. After extraction of surface contamination the measurement of conductivity follows, based on IPC-TM-650 2.3.25. The results are given in NaCl equivalents. Based on the gained results, you can check if the requirements for the maximum permissible ionic contamination were met.
TOC analysis*
The TOC analysis indicates the sum of the total organic carbon on the surface of your component and shows its organic contamination. For this purpose, the residuals are first extracted using high-purity water and then the extract is analysed. This test is especially important for the inspection of washing quality of medical devices.
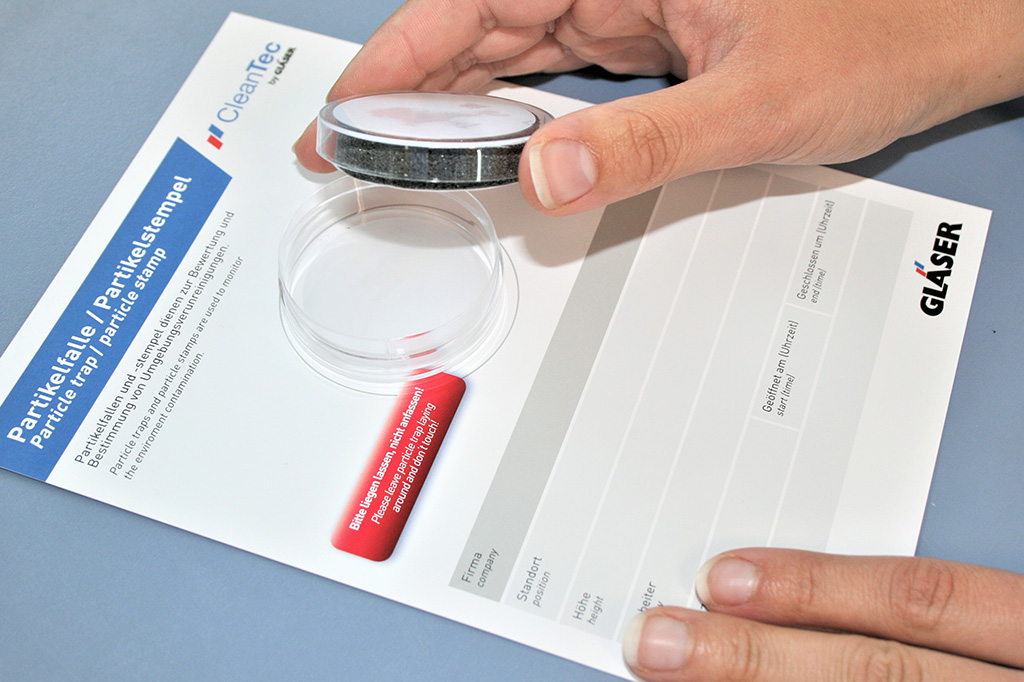
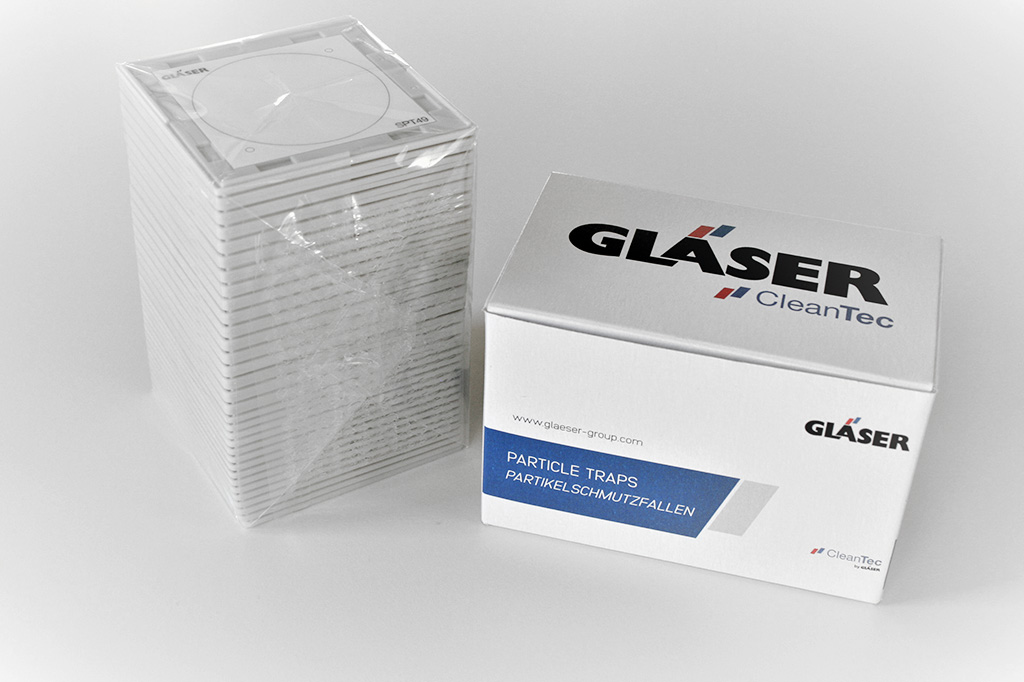
Would you like to find out whether a source of dirt is hiding in the immediate environment of your production? Or do you know already that your production is being impaired by dirt, but you cannot find its source? Just install one of our Gläser particle traps for a certain time to identify the source of dirt. Particle traps are used to measure sediment particles from environment contamination.
These result, for example, from internal transport routes, open entrances and windows, or by a particle precipitation by abrasion. Airborne particles will store on the adhesive label of the particle trap and can then be fed to a microscopic analysis. Send the traps to our laboratory and we will count and measure the particles. Particle stamp for a snapshotCompared to particle traps, particle stamps are used to measure sediment particles from surface contamination. You can easily stamp the requested surface. In this way you get a snapshot of contamination of a certain place. Detailed results of the contamination can be obtained by a microscopic analysis of the stamp in our laboratory.
With these concrete results, you can introduce measures completely to remedy the contamination. Your production process is cleaner now! More explanations and a detailed manual of particle trap/particle stamp available under “Downloads”.